Multirate Filtering for Digital Signal Processing: MATLAB® Applications, Chapter 9: Multirate Techniques in Filter Design and Implementation - Exercises
Contents
Exercise 9.1
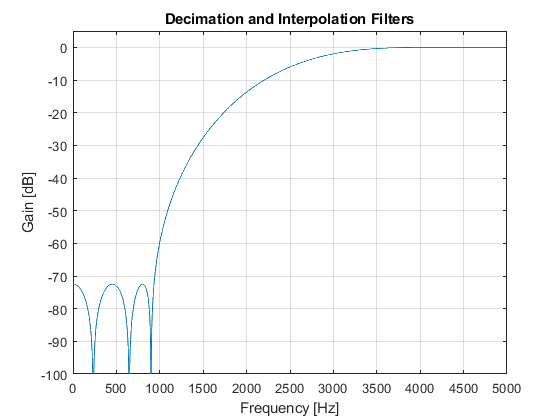
Design a lowpass FIR filter composed of a cascade
of a factor-of-2 decimator, kernel filter and factor-of-2 interpolator.
The specifications for the overall filter are the following:
- Sampling frequency: F0 = 10000 Hz
- Passband edge frequency Fp = 800 Hz
- Stopband edge frequency Fs = 1000 Hz
- Minimal attenuation in the stopband as = 60 dB
- Peak passband ripple δp = 0.01.
- Decimation and interpolation filters are identical halfband
filters.
Compute and plot:
- Magnitude responses of decimation and interpolation filters
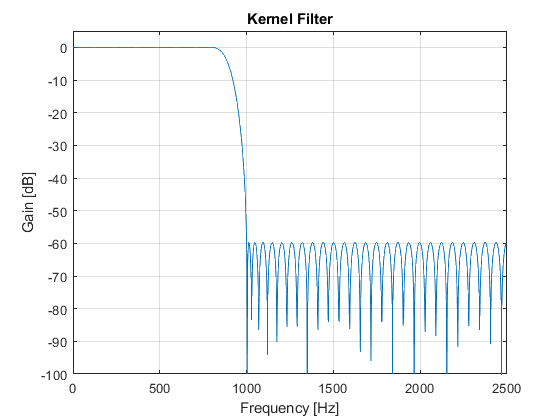
- Magnitude response of the kernel filter
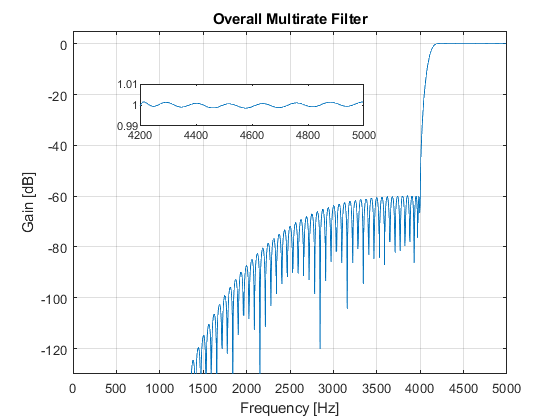
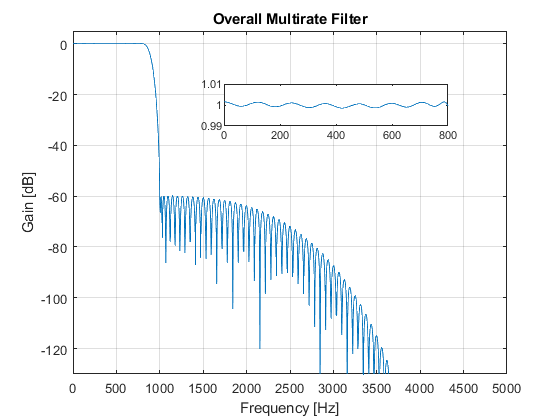
- Magnitude response of the overall multirate filter
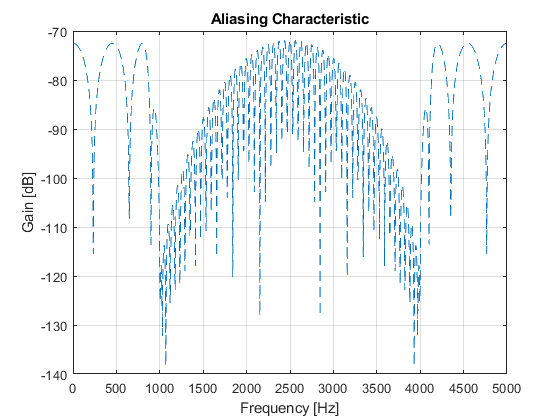
- Aliasing characteristic of the overall filter.
Used functions firgr (DSP System Toolbox), freqz (Signal Processing Toolbox)
close all, clear all
F0 = 10000;                                                 % Sampling frequency [Hz]
Fp = 800;                                                   % Passband edge frequency [Hz]
Fs = 1000;                                                  % Stopband edge frequency [Hz]
delta = 0.001;                                              % Peak stopband ripple
Nord_k = 82;                                                % Setting the kernel filter order
hk = firgr(Nord_k,[0,2*Fp/(F0/2),2*Fs/(F0/2),1],[1,1,0,0]); % Designing the kernel filter
hd = firhalfband('minorder',(2*Fs + Fp)/(3*F0/2),delta);    % Designing the decimation filter
hi = hd;                                                    % Interpolation filter
[Hk,Fk] = freqz(hk,1,1024,F0/2);
[Hk2,F] = freqz(upsample(hk,2),1,1024,F0);
[Hd,F] = freqz(hd,1,1024,F0);
figure(1),plot(F,20*log10(abs(Hd))),
ylabel('Gain [dB]'),xlabel('Frequency [Hz]'),
grid on,axis([0,5000,-100,5]),
title('Decimation and Interpolation Filters'),
figure(2),plot(Fk,20*log10(abs(Hk))),
ylabel('Gain [dB]'),xlabel('Frequency [Hz]'),
grid on,axis([0,2500,-100,5]),
title('Kernel Filter');
Hi = Hd;
H = (Hd.*Hk2).*Hi;                                          % The overall filter frequency response
figure(3),plot(F,20*log10(abs(H))),
ylabel('Gain [dB]'),xlabel('Frequency [Hz]'),
grid on,axis([0,5000,-130,5]),
title('Overall Multirate Filter');
g(1)=axes('Position',[0.40 0.70 0.40 0.1]);
plot(F(1:180),(abs(H(1:180)))), axis([0,800,0.99,1.01]);
[Hd_al,F]=freqz(hd,1,2048,F0,'whole');
Hd_a=Hd_al(1025:2048);
Alias=(Hd_a.*Hk2).*Hi;                                      % Aliasing characteristic
figure(4),plot(F(1:1024),20*log10(abs(Alias)),'--'),
ylabel('Gain [dB]'),xlabel('Frequency [Hz]'),
grid on
title('Aliasing Characteristic');

Exercise 9.2
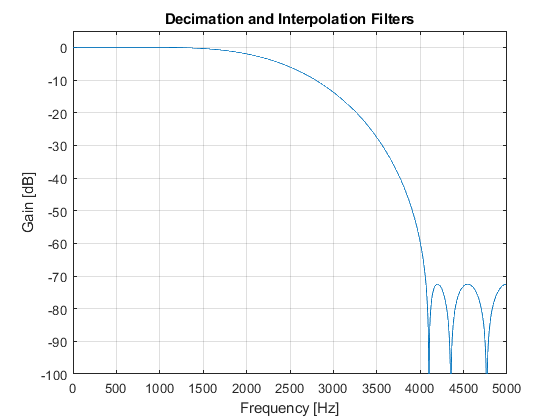
Compose the multirate highpass filter consisting of a cascade
of a factor-of-2 decimator, kernel filter and factor-of-2 interpolator.
The specifications for the overall filter are the following:
- Sampling frequency: F0 = 10000 Hz
- Passband edge frequency Fp = 4200 Hz
- Stopband edge frequency Fs = 4000 Hz
- Minimal attenuation in the stopband as = 60 dB
- Peak passband ripple δp = 0.01.
- Decimation and interpolation filters are identical halfband
filters.
Compute and plot:
- Magnitude responses of decimation and interpolation filters
- Magnitude response of the kernel filter
- Magnitude response of the overall multirate filter
- Aliasing characteristic of the overall filter.
Used functions firgr (DSP System Toolbox), freqz (Signal Processing Toolbox)
close all, clear all
F0 = 10000;                                                 % Sampling frequency [Hz]
Fp = 4200;                                                  % Passband edge frequency [Hz]
Fs = 4000;                                                  % Stopband edge frequency [Hz]
delta = 0.001;                                               % Peak stopband ripple
% In the first step, we design lowpass decimation/interpolation filters,
% and in the second step we convert lowpass decimation/interpolation
% filters into highpass filters. In the third step, we design the lowpass
% kernel filter, and compose the overall multirate highpass filter.

% FIRST STEP
% Computing the speciffications of the lowpass decimation/interpolation
% filters
Fp = F0/2-Fp;                                               % Passband edge frequency [Hz]
Fs = F0/2-Fs;                                               % Stopband edge frequency [Hz]
hd = firhalfband('minorder',(2*Fs + Fp)/(3*F0/2),delta);    % Designing the decimation filter

% SECOND STEP
% Converting the lowpass filter from the first step into highpass filter
n = 0:length(hd)-1;
hd = hd.*(-1).^n;                                           % Highpass decimation filter
hi = hd;                                                    % Highpass interpolation filter
[Hd,F] = freqz(hd,1,1024,F0);
figure(1),plot(F,20*log10(abs(Hd))),
ylabel('Gain [dB]'),xlabel('Frequency [Hz]'),
axis([0,5000,-100,5]),grid on,
title('Decimation and Interpolation Filters');

% THIRD STEP
Nord_k = 82;                                                % Setting the kernel filter order
hk = firgr(Nord_k,[0,2*Fp/(F0/2),2*Fs/(F0/2),1],[1,1,0,0]);     % Designing the kernel filter
[Hk,Fk] = freqz(hk,1,1024,F0/2);
[Hk2,F] = freqz(upsample(hk,2),1,1024,F0);
figure(2),plot(Fk,20*log10(abs(Hk))),
ylabel('Gain [dB]'),xlabel('Frequency [Hz]'),
axis([0,2500,-100,5]), grid on,
title('Kernel Filter');
Hi = Hd;
H = (Hd.*Hk2).*Hi;                                          % The overall filter frequency response
figure(3),plot(F,20*log10(abs(H))),
ylabel('Gain [dB]'),xlabel('Frequency [Hz]'),
axis([0,5000,-130,5]),grid on;
title('Overall Multirate Filter');
g(1)=axes('Position',[0.25 0.70 0.40 0.1]);
plot(F(840:1024),(abs(H(840:1024)))),axis([4200,5000,0.99,1.01]);
n=1:length(hd);
[Hd_al,F]=freqz(hd,1,2048,F0,'whole');
Hd_a=Hd_al(1025:2048);
Alias=(Hd_a.*Hk2).*Hi;                                      % Aliasing characteristic
figure(4),plot(F(1:1024),20*log10(abs(Alias)),'--'),
ylabel('Gain [dB]'),xlabel('Frequency [Hz]'), grid on,
title('Aliasing Characteristic');